Visualizing Processes
pVACviz provides a results visualization for exploring the results of pVACseq processes. It is able to visualize both the results from processes launched from pVACviz and results from any pVACseq process.
Visualizing Completed Processes
You may view visualizations of completed pVACseq processes launched from the pVACviz Start form from two locations within the application. The Manage section includes a process detail page, reachable by clicking on the Details link on the right side of rows in the process table. On the process detail page, the bottom right card contains a list of all files produced by the pVACseq process. Visualizable files will display a Visualize button that when clicked will load the visualization for that file.
Additionally, on the Visualize main page in the right hand column, all processes currently managed by pVACapi will be listed with their visualizable files. Clicking on a file will load the visualization for that file.
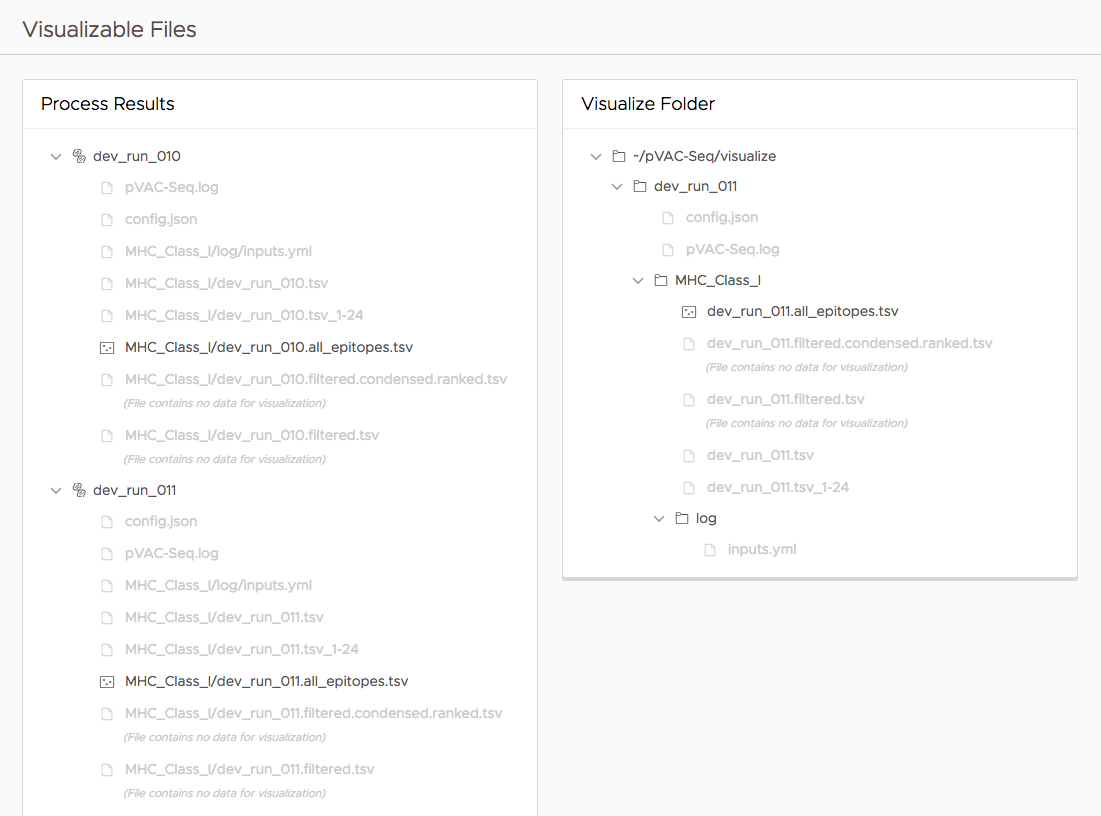
pVACviz page showing all visualizable files
Visualizing pVACseq Results Files
Any final results TSV file produced by pVACseq processes - whether launched via pVACviz or the command line - may be visualized with pVACviz. You may drop any file or folder in pVACapi’s /visualize directory, and it will scan it for visualizable files. These files will then be listed on in the right column of the main Vizualize page. Click on any of the listed pages to launch the visualization.
Scatterplot Visualization
On the visualization’s scatterplot are placed all of the data points contained in the tsv results file, one dot per row. A set of tools along the side of the visualization allow you to select and manipulate the plot in various ways.
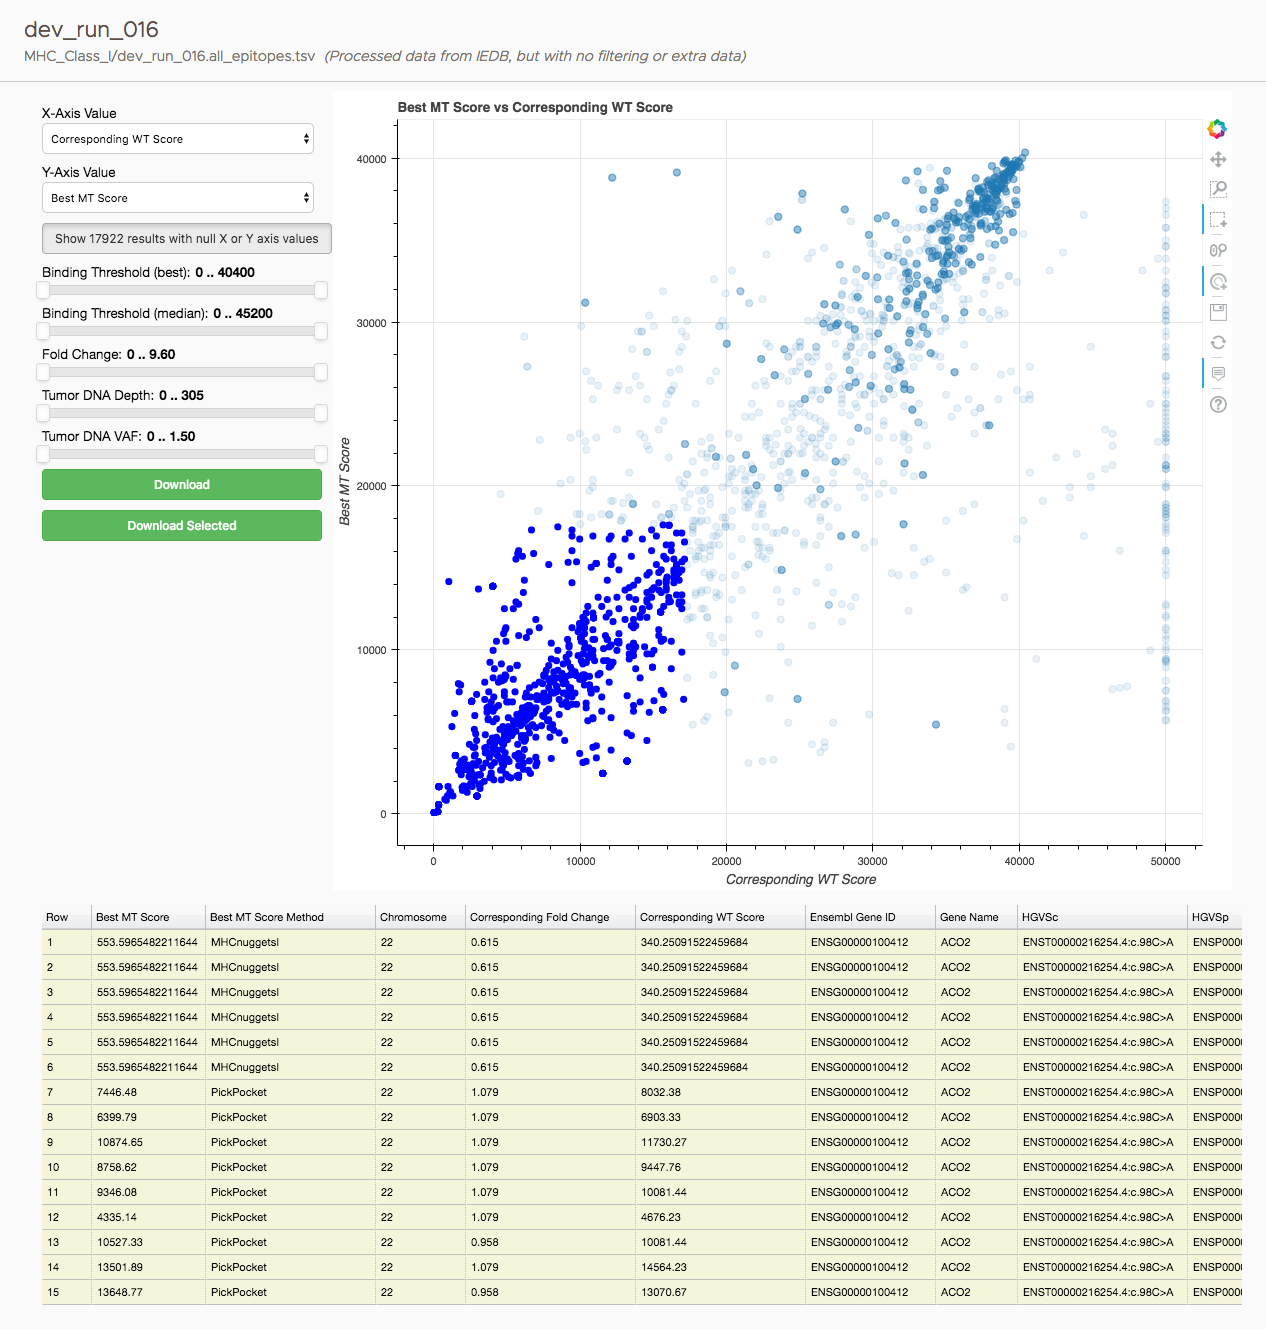
pVACviz scatterplot visualization
These icons toggle the following functions:
Icon |
Name |
Function |
|---|---|---|
|
Pan |
The pan tool allows the user to pan the plot by left-dragging a mouse or dragging a finger across the plot region. |
|
Box Zoom |
The box zoom tool allows the user to define a rectangular region to zoom the plot bounds too, by left-dragging a mouse, or dragging a finger across the plot area. |
|
Wheel Zoom |
The wheel zoom tool will zoom the plot in and out, centered on the current mouse location. It will respect any min and max values and ranges preventing zooming in and out beyond these. |
|
Tap |
The tap selection tool allows the user to select single points by clicking a left mouse button, or tapping with a finger. |
|
Save |
The save tool pops up a modal dialog that allows the user to save a PNG image of the plot. |
|
Reset |
The reset tool will restore the plot ranges to their original values. |
|
Hover |
The hover tool is a passive inspector tool. It is generally on at all times, but can be configured in the inspector’s menu associated with the toolbar. |


Axis Columns
To the left of the scatterplot display are a set of controls that allow you to set the X and Y axis for the scatterplot and filter the plot’s source data. The top two selectors allow you to choose any column of the result set to serve as the X/Y axis.
Filters
You may filter the source data using filters positioned beneath the axis column selectors. By default, points with null X or Y values are filtered out; you may toggle this filter by clicking the Show button. Beneath the show button are displayed a set of sliders that allow you to set min/max values for columns in the result set. Note that the visualization will not show sliders for columns that contain no data.
Data Table
Beneath the plot and filters you will find a datatable linked to both the filters and scatterplot points. Selecting any points in the plot will highlight the corresponsing rows in the data tables. The filters also affect the data table rows - any rows excluded by the filters will also be excluded from the datatable.
Exporting Visualization Data
Two buttons are provided for CSV export of the plot data. The ‘Download’ button will provide you with a CSV file that contains all of the data provdided to the plot - including filtered rows and rows with null X/Y coordinates. The ‘Download Selected’ button provides you with a CSV containing only the filtered/selected rows from the plot and datatable.