Neofox Features
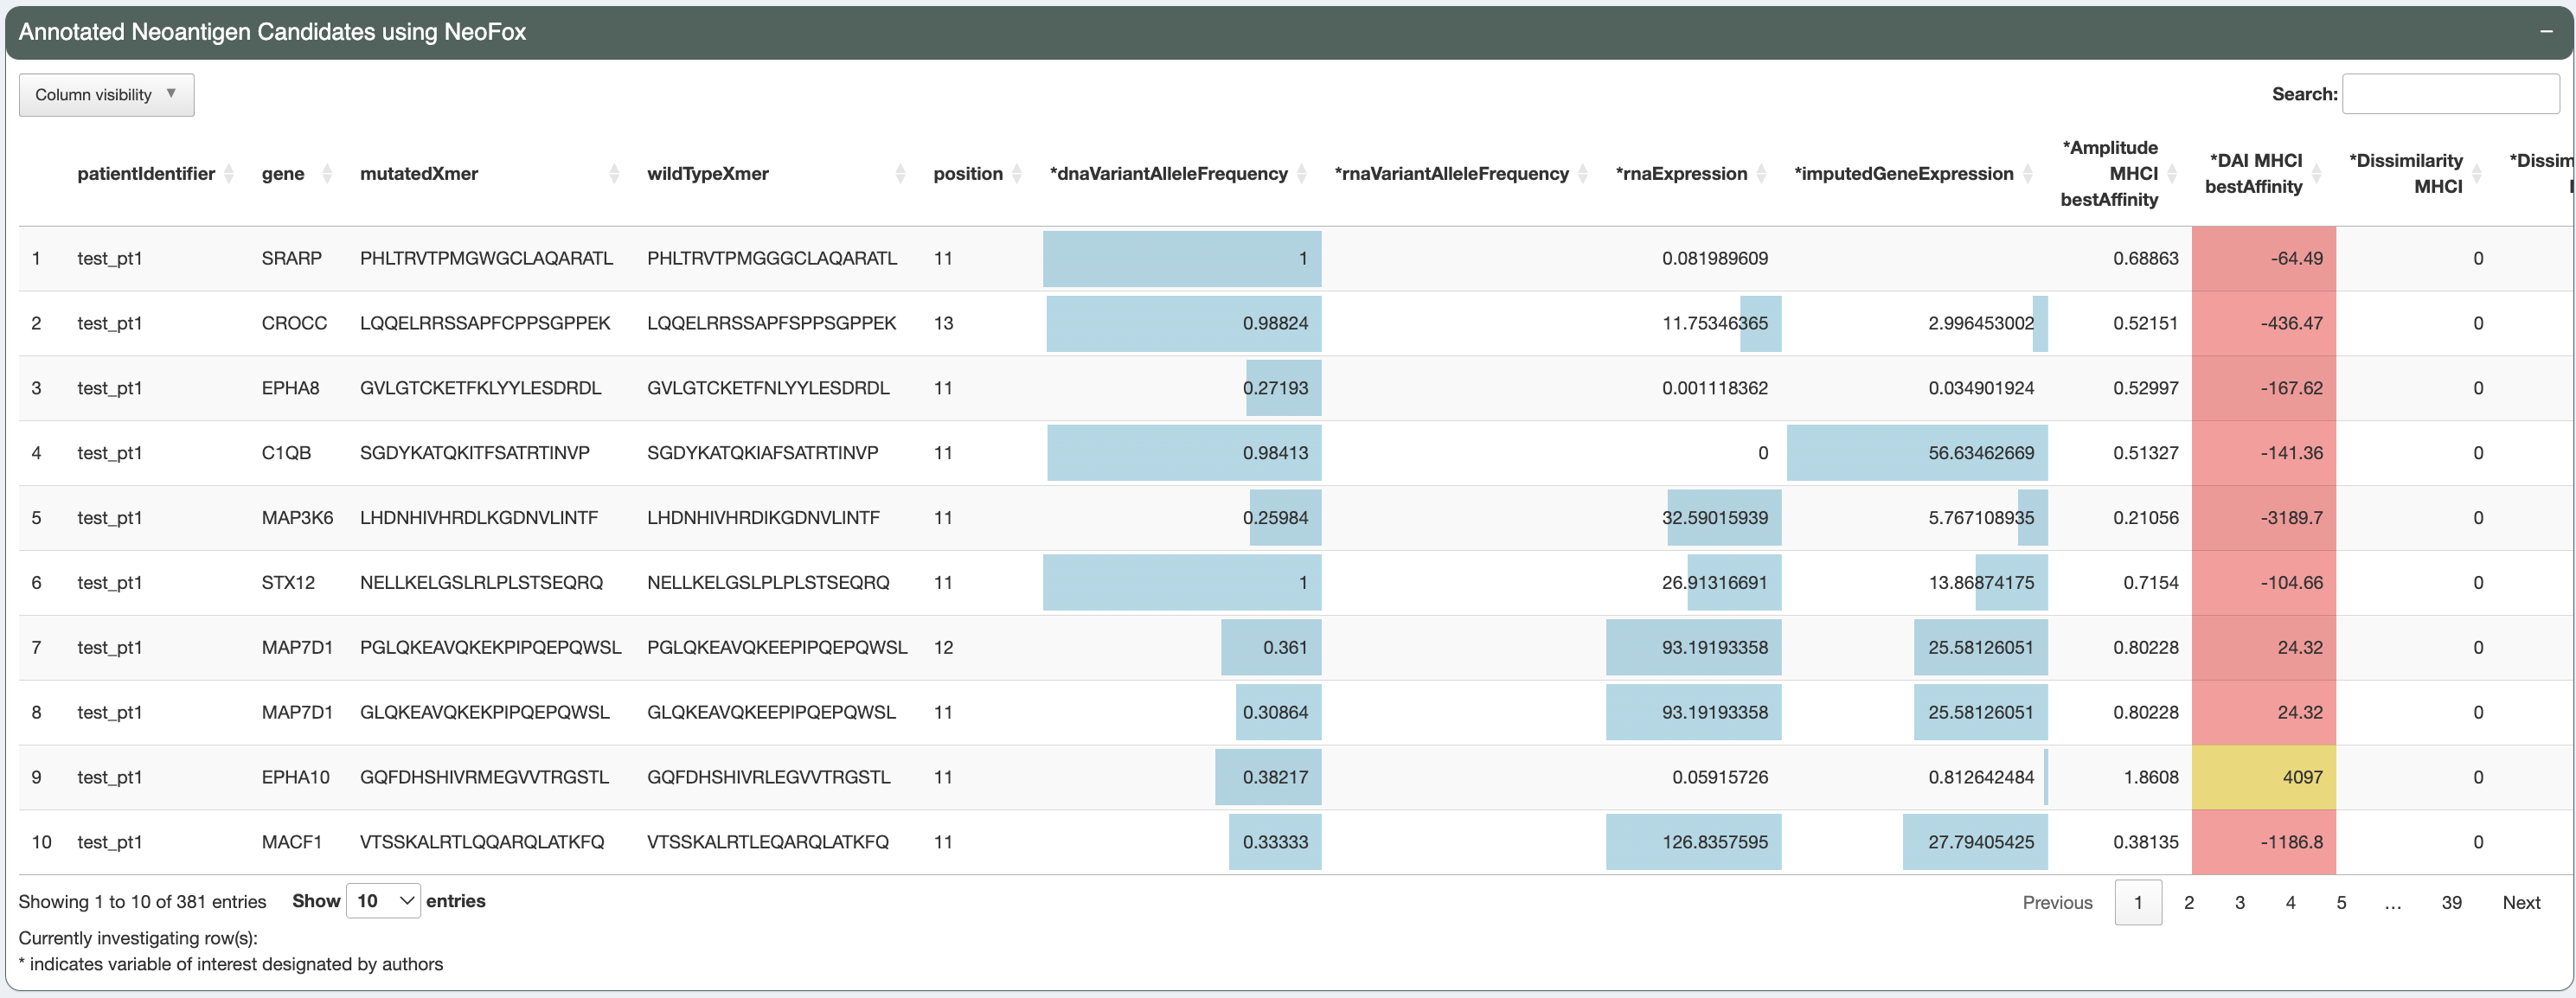
Annotated Neoantigen Candidates Table
The Annotated Neoantigen Candidates table is generated as output from NeoFox and includes many annotations based on published neoantigen features. Users can page through the candidates, sort by any feature, and select one or more candidates for further investgation. We have marked the features we find most informative with an asterisk. These columns are selected by default but additional columns can be selected using the “Column Visibility” dropdown.
Colored heatmap cell backgrounds on binding affinity and rank columns indicate where the value falls in comparison to the default 500 nM binding affinity and 0.5 percentile thresholds, respectively. Green background colors indicate a value below the threshold while yellow to red colors indicate a progressively higher value above the threshold. Horizontal barplot backgrounds on the expression and VAF columns reflect how close the values are to the “ideal” values of 50 and 1, respectively.
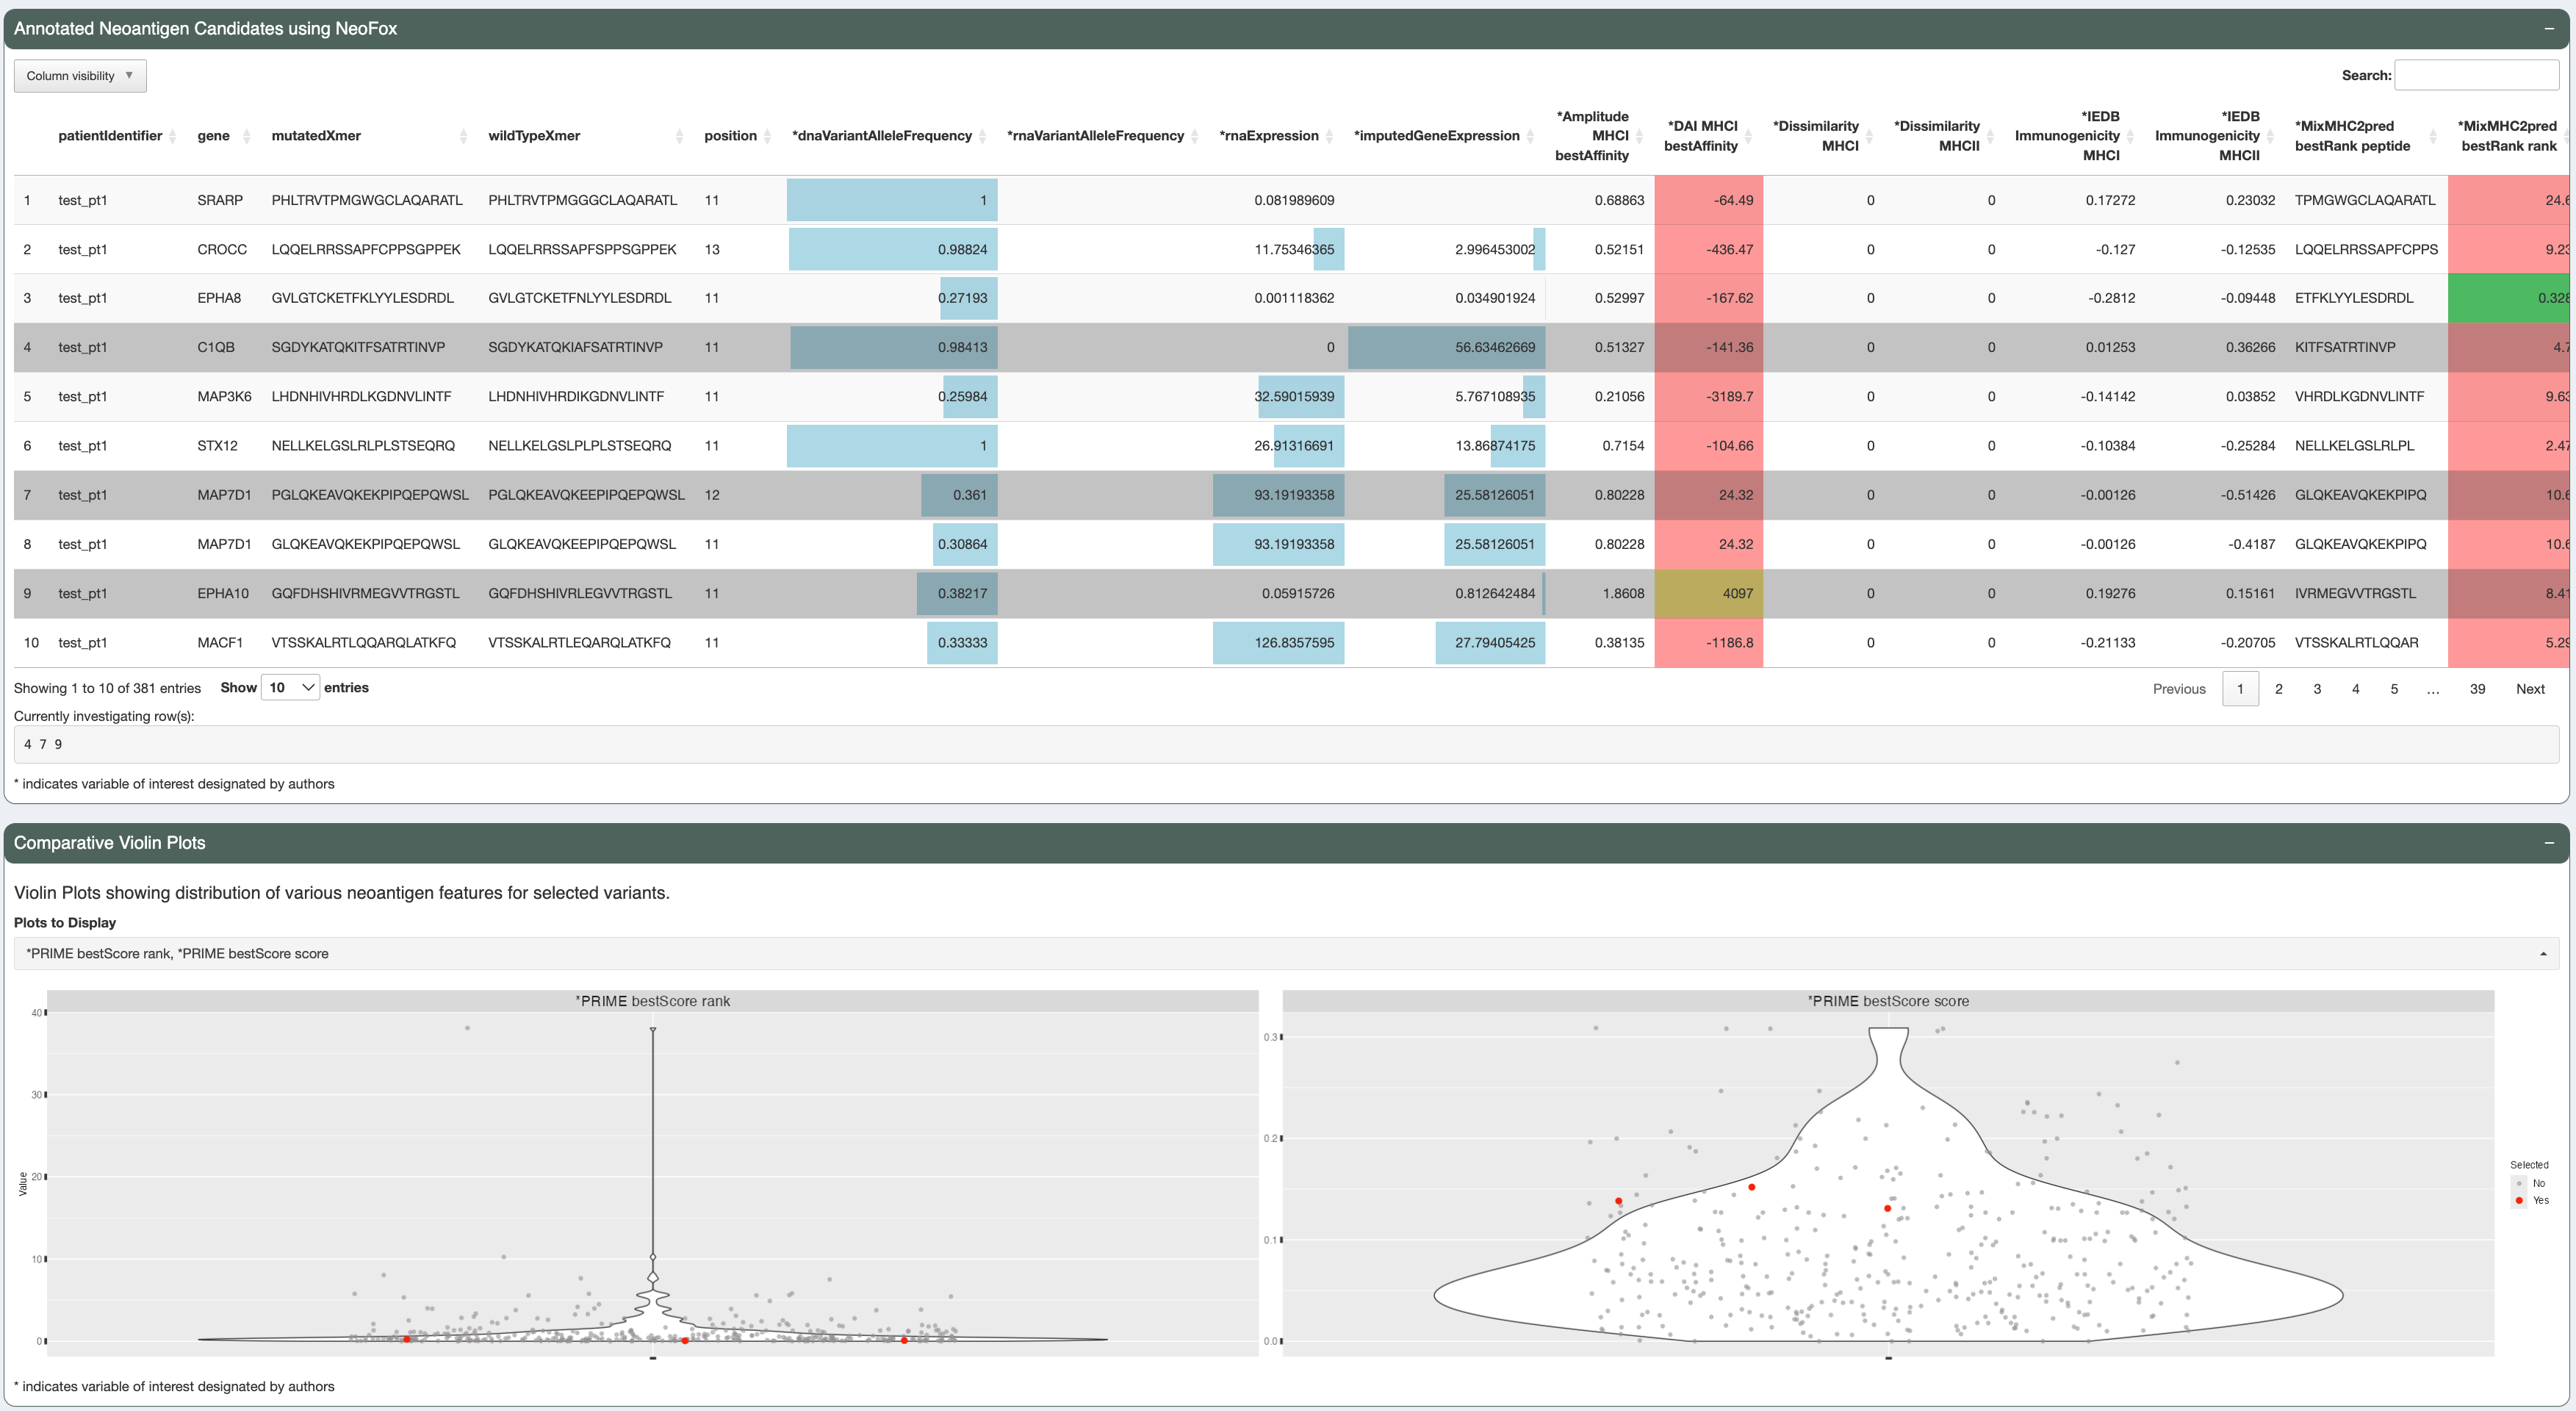
Comparative Violin Plots
Users can investigate how selected candidates relate to the the rest of the dataset using the Comparative Violin Plots. Users can select as many candidates as they would like which will then be highlighted in red in the violin plots. They can also select up to six features to view at a time. We have pre-selected five features which we found informative.
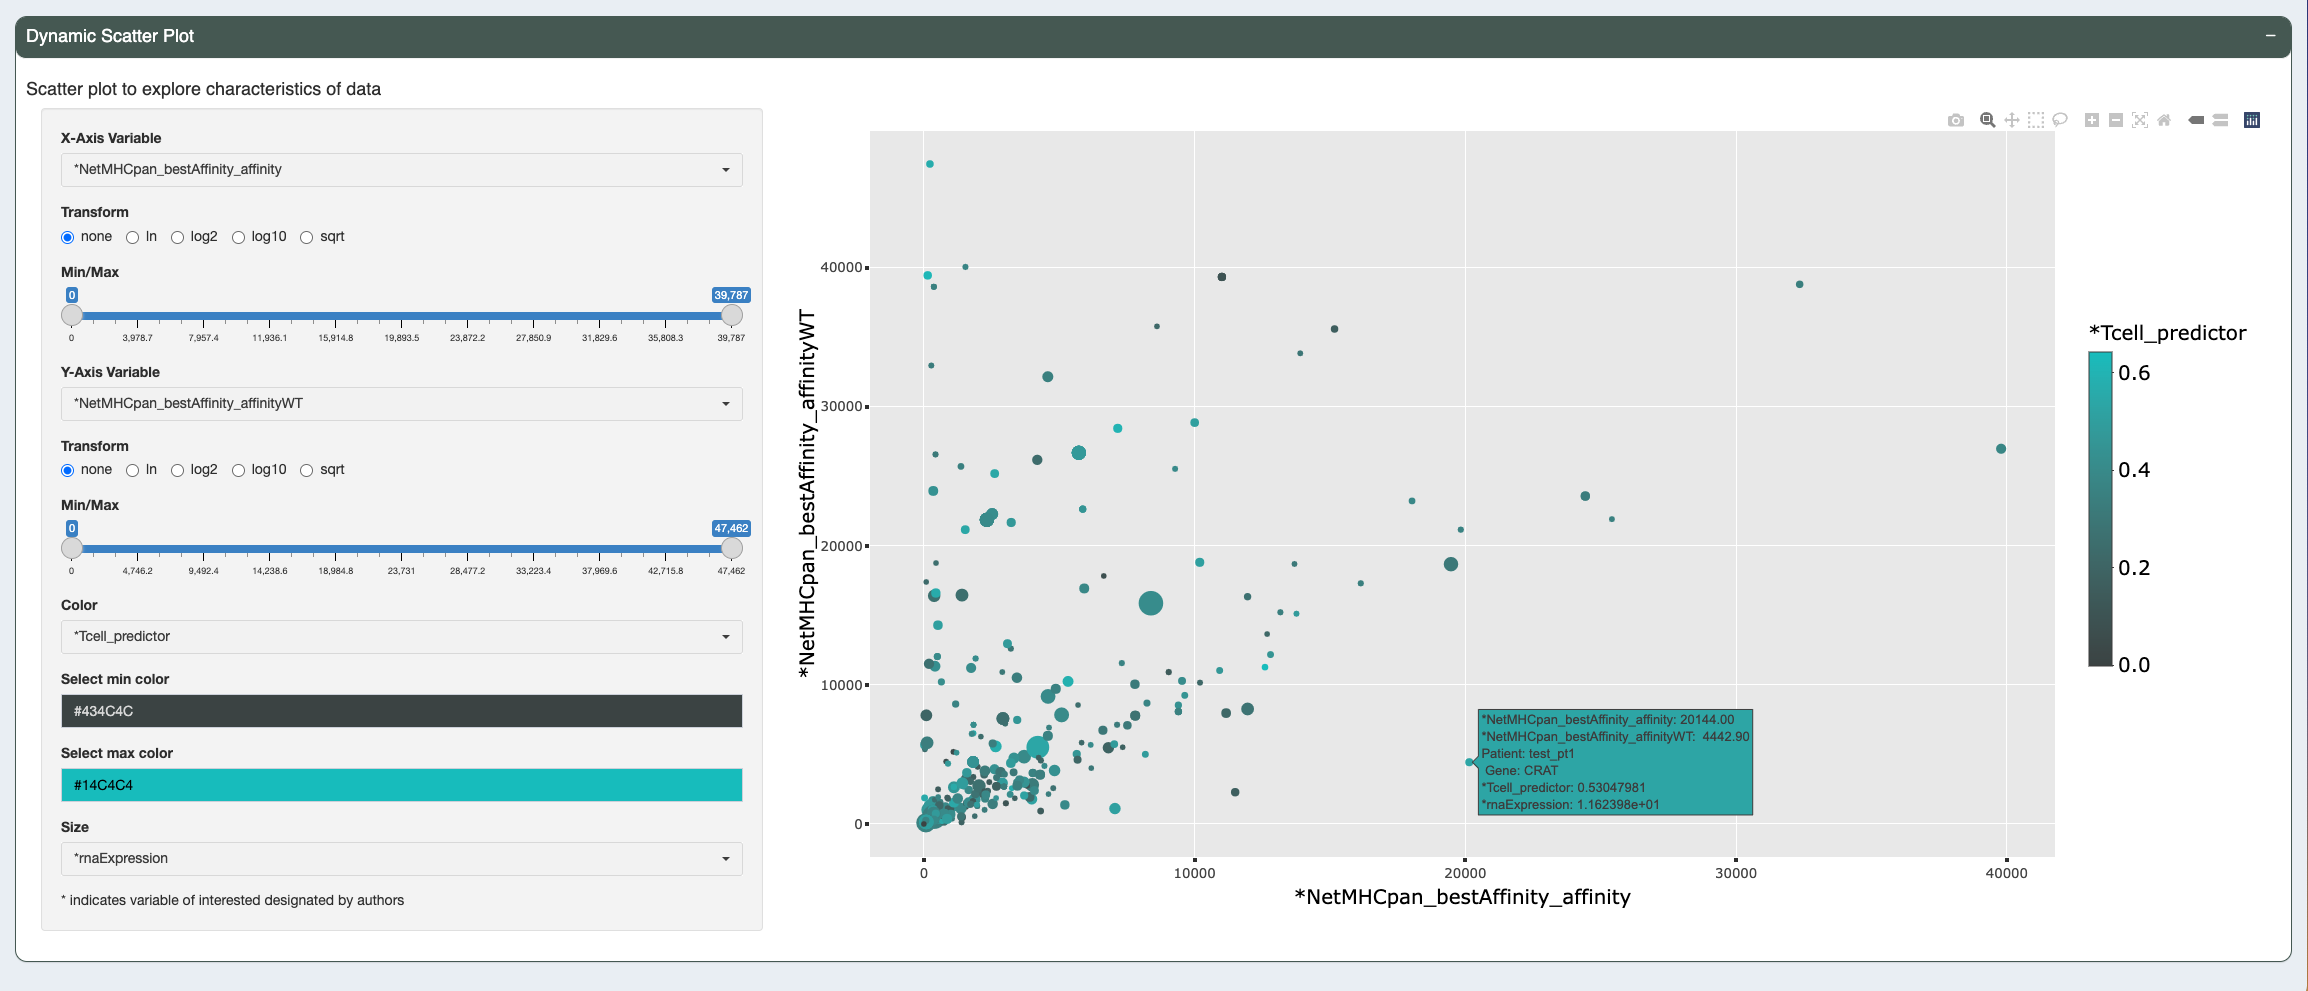
Dynamic Scatter Plot
Users can further investigate the data using the Dynamic Scatter Plot where they can choose any feature to be the X-axis, Y-axis, color, or size variable. The X and Y scale can be transformed and a range of values subsetted. The color represents the minimum and maximum values and can be changed to any HEX value.
To view information about different points on the plot simply mouse over individual points. Users can export the current scatter plot by using the camera icon at the top right corner of the plot.