Output Files
The pVACseq pipeline will write its results in separate folders depending on which prediction algorithms were chosen:
MHC_Class_I: for MHC class I prediction algorithmsMHC_Class_II: for MHC class II prediction algorithmscombined: If both MHC class I and MHC class II prediction algorithms were run, this folder combines the neoepitope predictions from both
Each folder will contain the same list of output files (listed in the order created):
File Name |
Description |
|---|---|
|
An intermediate file with variant, transcript, coverage, vaf, and expression information parsed from the input files. |
|
The above file but split into smaller chunks for easier processing with IEDB. |
|
A fasta file with mutant and wildtype peptide subsequences for all processable variant-transcript combinations. |
|
A fasta file with mutant and wildtype peptide subsequences specific for use in running the net_chop tool. |
|
A list of all predicted epitopes and their binding affinity scores, with
additional variant information from the |
|
The above file after applying all filters, with (optionally) cleavage site, stability predictions, and reference proteome similarity metrics added. |
|
An aggregated version of the |
|
A file outlining details of reference proteome matches |
|
A JSON file with detailed information about the predicted epitopes, formatted for pVACview. This file, in combination with the aggregated.tsv file, is required to visualize your results in pVACview. |
Various R files |
pVACview R Shiny application files. |
|
Directory containing image files for pVACview. |
|
A version of the |
Filters applied to the filtered.tsv file
The filtered.tsv file is the all_epitopes file with the following filters applied (in order):
Binding Filter
Coverage Filter
Transcript Filter
Top Score Filter
Please see the Standalone Filter Commands documentation for more information on each individual filter. The standalone filter commands may be useful to reproduce the filtering or to chose different filtering thresholds.
all_epitopes.tsv and filtered.tsv Report Columns
Column Name |
Description |
|---|---|
|
The chromosome of this variant |
|
The start position of this variant in the zero-based, half-open coordinate system |
|
The stop position of this variant in the zero-based, half-open coordinate system |
|
The reference allele |
|
The alt allele |
|
The Ensembl ID of the affected transcript |
|
The transcript support level (TSL)
of the affected transcript. |
|
The protein sequence length of the affected transcript |
|
Whether or not the Best Transcript is the MANE Select transcript.
|
|
Whether or not the Best Transcript is the Canonical transcript. |
|
The biotype of the affected transcript |
|
A list of CDS flags set on the transcript by VEP. |
|
The Ensembl ID of the affected gene |
|
The type of variant. |
|
The amnio acid change of this mutation |
|
The protein position of the mutation |
|
The Ensembl gene name of the affected gene |
|
The HGVS coding sequence variant name |
|
The HGVS protein sequence variant name |
|
The HLA allele for this prediction |
|
The peptide length of the epitope |
|
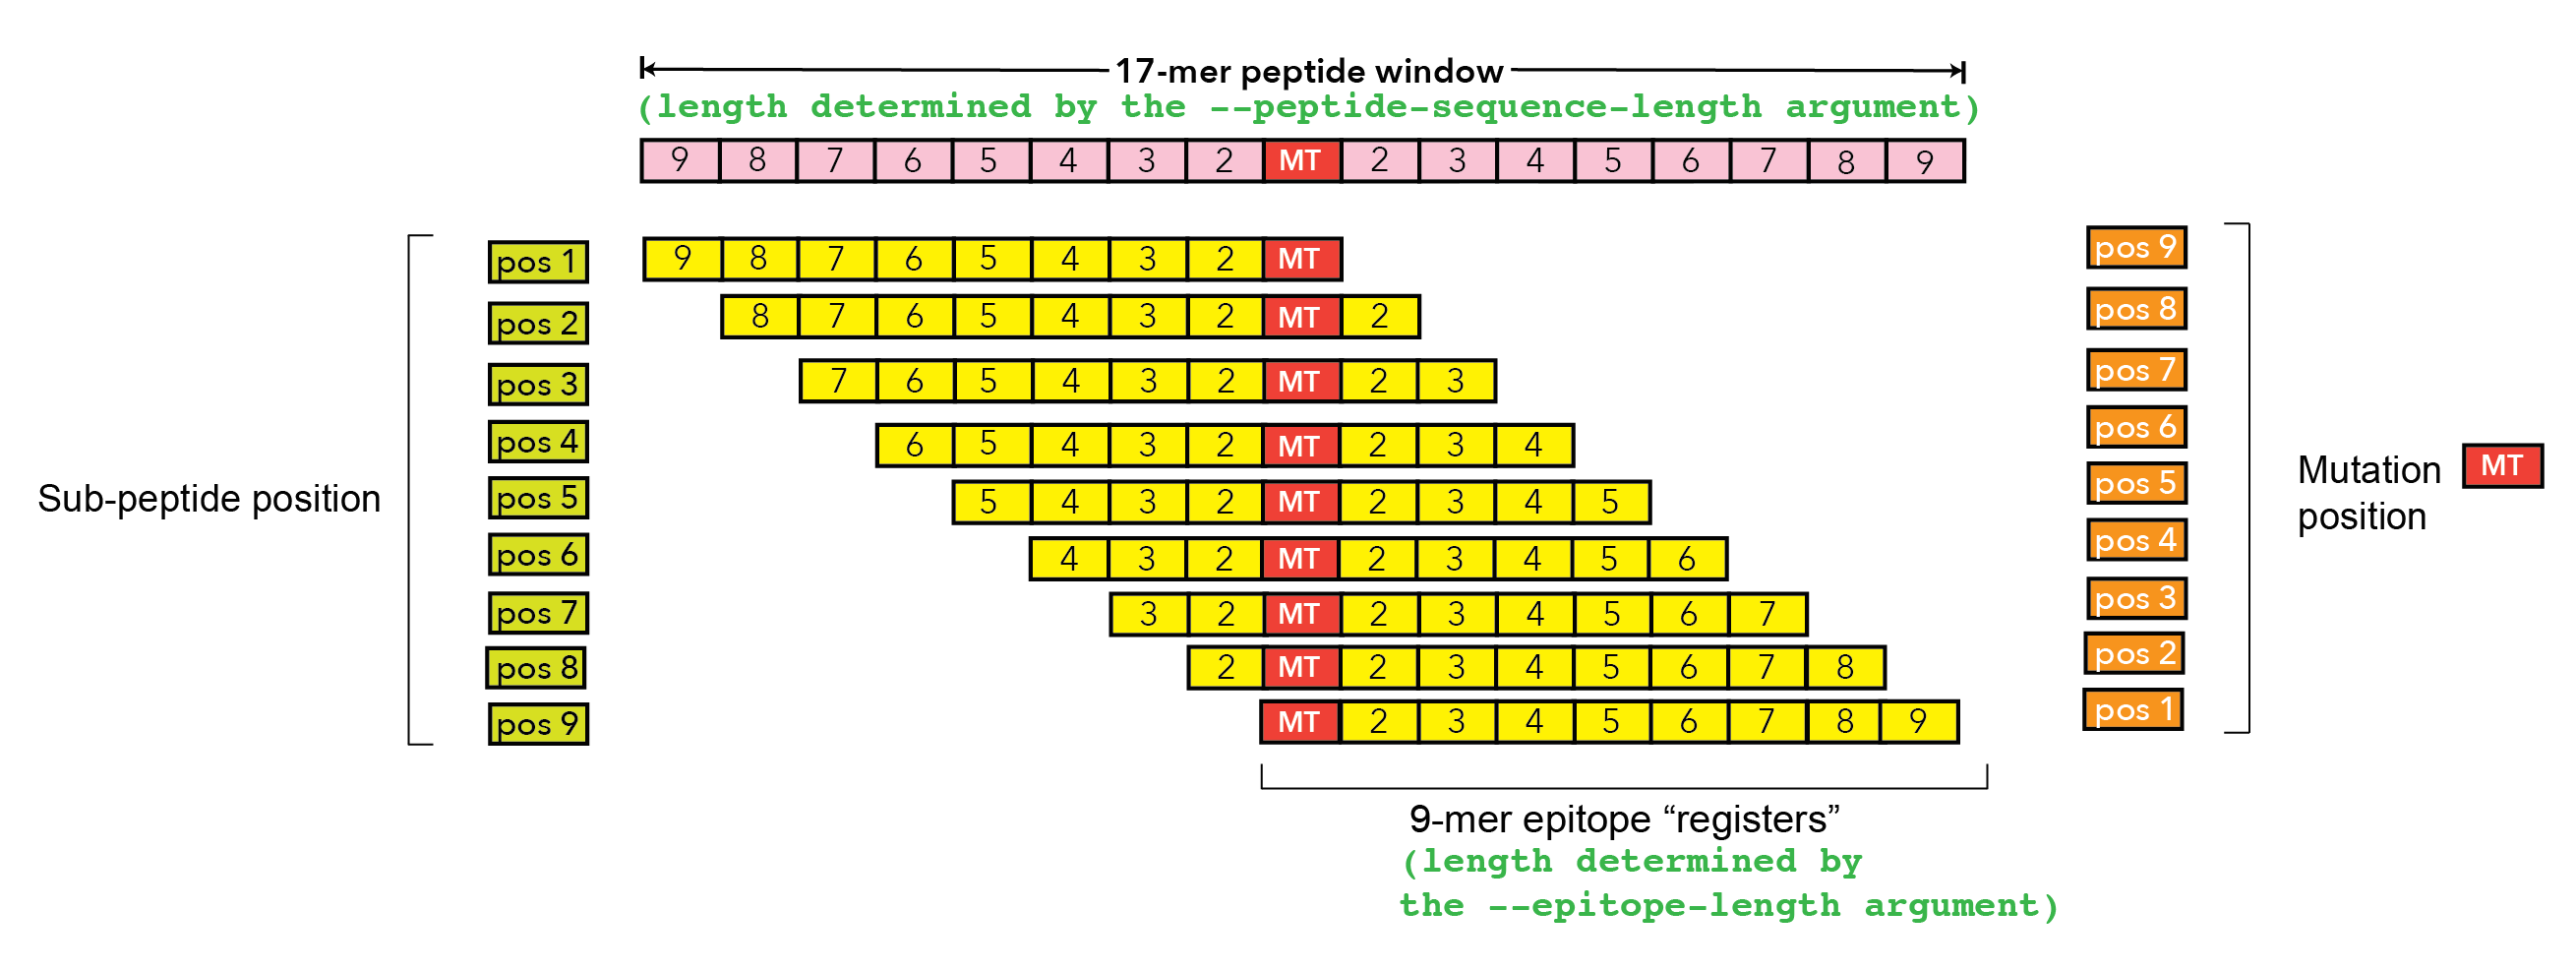
The one-based position of the epitope within the protein sequence used to make the prediction |
|
A comma-separated list of all amino acid positions in the |
|
The mutant epitope sequence |
|
The wildtype (reference) epitope sequence at the same position in the full protein sequence. |
|
Prediction algorithm with the lowest mutant IC50 binding affinity for this epitope |
|
Lowest IC50 binding affinity of all prediction algorithms used |
|
IC50 binding affinity of the wildtype epitope. |
|
|
|
Prediction algorithm with the lowest percentile rank for this epitope |
|
Lowest percentile rank of all prediction algorithms used (those that provide percentile output) |
|
Percentile rank of the wildtype epitope using the |
|
Binding prediction algorithm with the lowest binding percentile rank for this epitope |
|
Lowest binding percentile rank of all binding prediction algorithms used (those that provide percentile output) |
|
Binding percentile rank of the wildtype epitope using the |
|
Immunogenicity prediction algorithm with the lowest immunogenicity percentile rank for this epitope |
|
Lowest immunogenicity percentile rank of all immunogenicity prediction algorithms used (those that provide percentile output) |
|
Immunogenicity percentile rank of the wildtype epitope using the |
|
Presentation prediction algorithm with the lowest presentation percentile rank for this epitope |
|
Lowest presentation percentile rank of all presentation prediction algorithms used (those that provide percentile output) |
|
Presentation percentile rank of the wildtype epitope using the |
|
Tumor DNA depth at this position. |
|
Tumor DNA variant allele frequency (VAF) at this position. |
|
Tumor RNA depth at this position. |
|
Tumor RNA variant allele frequency (VAF) at this position. |
|
Normal DNA depth at this position. |
|
Normal DNA variant allele frequency (VAF) at this position. |
|
Gene expression value for the annotated gene containing the variant. |
|
Transcript expression value for the annotated transcript containing the variant. |
|
Median IC50 binding affinity of the mutant epitope across all binding prediction algorithms used |
|
Median IC50 binding affinity of the wildtype epitope across all binding prediction algorithms used.
|
|
|
|
Median percentile rank of the mutant epitope across all prediction algorithms (those that provide percentile output) |
|
Median percentile rank of the wildtype epitope across all prediction algorithms used (those that provide percentile output)
|
|
Median binding percentile rank of the mutant epitope across all binding prediction algorithms (those that provide percentile output) |
|
Median binding percentile rank of the wildtype epitope across all
binding prediction algorithms used (those that provide percentile output)
|
|
Median immunogenicity percentile rank of the mutant epitope across all immunogenicity prediction algorithms (those that provide percentile output) |
|
Median immunogenicity percentile rank of the wildtype epitope across
all immunogenicity prediction algorithms used (those that provide percentile output)
|
|
Median presentation percentile rank of the mutant epitope across all presentation prediction algorithms (those that provide percentile output) |
|
Median presentation percentile rank of the wildtype epitope across all
presentation prediction algorithms used (those that provide percentile output)
|
|
ic50 binding affinity scores, binding scores, presentation scores, processing scores, or immunogenicity scores as well as percentile ranks
for the |
|
A unique idenitifer for this variant-transcript combination |
|
A list of positions in the |
|
Is the |
|
Mean hydropathy of last 7 residues on the C-terminus of the peptide |
|
Max GRAVY score of any kmer in the amino acid sequence. Used to determine if there are any extremely hydrophobic regions within a longer amino acid sequence. |
|
Is N-terminal amino acid a Glutamine, Glutamic acid, or Cysteine? |
|
Is the C-terminal amino acid a Cysteine? |
|
Is the C-terminal amino acid a Proline? |
|
Number of Cysteines in the amino acid sequence. Problematic because they can form disulfide bonds across distant parts of the peptide |
|
Is the N-terminal amino acid a Asparagine? |
|
Number of Asparagine-Proline bonds. Problematic because they can spontaneously cleave the peptide |
|
Position of the highest predicted cleavage score |
|
Highest predicted cleavage score |
|
List of all cleavage positions and their cleavage score |
|
Stability of the pMHC-I complex |
|
Half-life of the pMHC-I complex |
|
The % rank stability of the pMHC-I complex |
|
Nearest neighbor to the |
all_epitopes.aggregated.tsv Report Columns
The all_epitopes.aggregated.tsv file is an aggregated version of the all_epitopes TSV.
It shows the best-scoring epitope
for each variant, and outputs additional binding affinity, expression, and
coverage information for that epitope. It also gives information about the
total number of well-scoring epitopes for each variant, the number of
transcripts covered by those epitopes, as well as the HLA alleles that those
epitopes are well-binding to. Lastly, the report will bin variants into tiers
that offer suggestions as to the suitability of variants for use in vaccines.
Additionally, a metrics.json file gets created, containing metadata about the
Best Peptide as well as alternate neoantigen canddiates for each variant. This
file can be loaded into pVACview in conjunction with the aggregated report in
order to visualize the candidates. In order to limit the size of the
metrics.json file, only a limited number of neoantigen candidates are included
in this file. Only neoantigen candidates meeting the --aggregate-inclusion-binding-threshold
are included in this file (default: 5000).
If the number of unique epitopes for a mutation meeting this threshold exceeds the
--aggregate-inclusion-count-limit, only the top n epitopes up to this
limit are included (default: 15). The method for selecting the top n epitopes is analogous to
the one used to determine the best-scoring epitope. For
each epitope of a mutation, all result entries (i.e. for different HLA
alleles and transcripts) meeting the
--aggregate-inclusion-binding-threshold are considered and the best
entry is selected. The selection of best entry for each epitope are then sorted
by the transcript biotype, the transcript support level, whether or not the
anchor criteria was passed, the MT IC50 score, the transcript length,
and the MT percentile. From this sorted list the top n entries are selected up
to the --aggregate-inclusion-count-limit.
If the Best Peptide does not meet the aggregate inclusion criteria, it will be still be
included in the metrics.json file and counted in the Num Included
Peptides.
Whether the median or the lowest binding affinity metrics are used for determining
the included epitopes, selecting the best-scoring epitope, and which values are
output in the IC50 and %ile columns is controlled by the --top-score-metric
parameter.
Column Name |
Description |
|---|---|
|
A unique identifier for the variant |
|
A unique identifier for the variant and Best Transcript |
HLA Alleles (multiple) |
For each HLA allele in the run, the number of this variant’s epitopes that bound well to the HLA allele (with median/lowest mutant binding affinity < binding_threshold) |
|
The Ensembl gene name of the affected gene |
|
The amino acid change for the mutation |
|
The number of transcripts for this mutation that resulted in at least one well-binding peptide (median/lowest mutant binding affinity < 500). |
|
The best mutant epitope sequence (see Best Peptide Criteria below for more details on how this is determined) |
|
The best transcript of all transcripts coding for the Best Peptide (see Best Peptide Criteria below for more details on how this is determined) |
|
Whether or not the Best Transcript is the MANE Select transcript.
|
|
Whether or not the Best Transcript is the Canonical transcript. |
|
The Transcript Support Level of the Best Transcript. |
|
The Allele that the Best Peptide is binding to |
|
A comma-separated list of all amino acid positions in the |
|
A list of positions in the Best Peptide that are problematic. |
|
The number of included peptides according to the
|
|
The number of included peptides for this mutation that are well-binding. |
|
Median or lowest ic50 binding affinity of the Best Peptide across all prediction algorithms used |
|
Median or lowest ic50 binding affinity of the corresponding wildtype epitope across all prediction algorithms used. |
|
Median or lowest percentile rank of the Best Peptide across all prediction algorithms used |
|
Median or lowest percentile rank of the corresponding wildtype epitope across all prediction algorithms used |
|
Median or lowest binding percentile rank of the Best Peptide across all binding prediction algorithms used |
|
Median or lowest binding percentile rank of the corresponding wildtype epitope across all binding prediction algorithms used |
|
Median or lowest immunogenicity percentile rank of the Best Peptide across all immunogenicity prediction algorithms used |
|
Median or lowest immunogenicity percentile rank of the corresponding wildtype epitope across all immunogenicity prediction algorithms used |
|
Median or lowest presentation percentile rank of the Best Peptide across all presentation prediction algorithms used |
|
Median or lowest presentation percentile rank of the corresponding wildtype epitope across all presentation prediction algorithms used |
|
Gene expression value for the annotated gene containing the variant. |
|
Tumor RNA variant allele frequency (VAF) at this position. |
|
RNA Expr * RNA VAF |
|
Tumor RNA depth at this position. |
|
Tumor DNA variant allele frequency (VAF) at this position. |
|
A tier suggesting the suitability of variants for use in vaccines. |
|
Whether or not there a match of the mutated peptide sequence to the reference proteome. |
|
Column to store the evaluation of each variant when evaluating the run in pVACview. Either |
<sample_name>.MHC_I.all_epitopes.aggregated.ML_predict.tsv Report Columns
The <sample_name>.MHC_I.all_epitopes.aggregated.ML_predict.tsv file is generated when using the add_ml_predictions
tool or when running pVACseq with both MHC Class I and Class II predictions and the --run-ml-predictions flag enabled.
This file contains all columns from the Class I aggregated file (all_epitopes.aggregated.tsv) with one additional ML prediction column added.
The file is written to the same folder as the Class I aggregated file (MHC_Class_I within the output directory).
Column Name |
Description |
|---|---|
All columns from |
All columns described in the all_epitopes.aggregated.tsv Report Columns section above are included in this file. |
|
Populated with ML-predicted evaluation status for each candidate. Values: |
|
ML-based prediction evaluation with probability score. Format: |
Best Peptide Criteria
To determine the Best Peptide, all peptides meeting the
--aggregate-inclusion-threshold and --aggregate-inclusion-count-limit
(see above) for a variant are evaluated as follows:
If
--allow-inclomplete-transcriptsflag is set, pick the entries without aTranscript CDS Flagsset.Of the remaining entries, pick the entries where the
Biotypeisprotein_coding.Of the remaining entries, pick the entries that pass at least one of the transcript criteria selected in the
--transcript-prioritization-strategytaking into consideration the--maximum-transcript-support-leveliftslis one of the selected criteria.Of the remaining entries, pick the entries with no
Problematic Positions.Of the remaining entries, pick the ones passing the Anchor Criteria (see Criteria Details section below)
For the remaining entries, calculate a rank for all the metrics specified via the
--top-score-metric2parameter and sum them. Whether the lowest or median value is considered for each metric is controlled by the--top-score-metricparameter. Sort the remaining entries on this sum rank followed by the rank of the first--top-score-metric2specified (to break any ties in the sum rank),MANE Select(True),Canonical(True),Transcript Support Level,Transcript Length, andTranscript Expression. Select the highest sorted entry.
The pVACseq Aggregate Report Tiers
Tiering Parameters
To tier the Best Peptide, several cutoffs can be adjusted using arguments provided to the pVACseq run:
Parameter |
Description |
Default |
|---|---|---|
|
The threshold used for filtering epitopes on the IC50 MT binding affinity. |
500 |
|
Instead of the hard cutoff set by the |
False |
|
Use this threshold to filter epitopes on the IC50 %ile MT score. |
2.0 |
|
Use this threshold to filter epitopes on the Pres %ile MT score. |
2.0 |
|
Use this threshold to filter epitopes on the IM %ile MT score. |
2.0 |
|
Specify the candidate inclusion strategy. The |
conservative |
|
Value between 0 and 1 indicating the fraction of tumor cells in the tumor sample. Information is used for a simple estimation of whether variants are subclonal or clonal based on VAF. If not provided, purity is estimated directly from the VAFs. |
None |
|
Tumor RNA VAF Cutoff. Used to calculate the allele expression cutoff for tiering. |
0.25 |
|
Tumor RNA Coverage Cutoff. Used as a cutoff for tiering. |
10 |
|
Gene and Expression cutoff. Used to calculate the allele expression cutoff for tiering. |
1.0 |
|
Which transcript-specific criteria to consider to pass a transcript. |
[‘mane_select’, ‘canonical’, ‘tsl’] |
|
The threshold to evaluate an epitope’s best transcript on the Ensembl transcript support level (TSL). Transcript support level needs to be <= this cutoff to be included most tiers when tsl is included as transcript prioritization strategy. |
1 |
|
Use allele-specific anchor positions when tiering epitopes in the aggregate report. This option is available for 8, 9, 10, and 11mers and only for HLA-A, B, and C alleles. If this option is not enabled or as a fallback for unsupported lengths and alleles, the default positions of [1, 2, epitope length - 1, and epitope length] are used. Please see https://doi.org/10.1101/2020.12.08.416271 for more details. |
False |
|
For determining allele-specific anchors, each position is assigned a score based on how binding is influenced by mutations. From these scores, the relative contribution of each position to the overall binding is calculated. Starting with the highest relative contribution, positions whose score together account for the selected contribution threshold are assigned as anchor locations. As a result, a higher threshold leads to the inclusion of more positions to be considered anchors. |
0.8 |
|
Set this flag in order to run reference proteome similarity analysis
and enable |
False |
|
Configure this parameter in order to define amino acids problematic for
the desired therapy delivery platform and enable |
None |
Tiers
Given the thresholds provided above, the Best Peptide is evaluated and binned into a tier as follows:
Tier |
Criteria |
|---|---|
|
Best Peptide passes the scores, reference match, expression, transcript, clonal, problematic position, and anchor criteria |
|
Best Peptide fails the binding criteria but passed the presentation, immunogenicity, reference match, expression, transcript, clonal, problematic position, and anchor criteria |
|
Best Peptide fails the presentation criteria but passed the binding, immunogenicity, reference match, expression, transcript, clonal, problematic position, and anchor criteria |
|
Best Peptide fails the immunogenicity criteria but passed the binding, presentation, reference match, expression, transcript, clonal, problematic position, and anchor criteria |
|
Best Peptide fails the reference match criteria but passes the scores, expression, transcript, clonal, problematic position, and anchor criteria |
|
Best Peptide fails the transcript criteria but passes the scores, reference match, expression, clonal, problematic position, and anchor criteria |
|
Best Peptide meets the low expression criteria and passes the scores, reference match, transcript, clonal, problematic position, and anchor criteria |
|
Best Peptide fails the anchor criteria but passes the scores, reference match, expression, transcript, clonal, and problematic position criteria |
|
Best Peptide fails the clonal criteria but passes the scores, reference match, expression, transcript, problematic position, and anchor criteria |
|
Best Peptide fails the problematic position criteria but passes the scores, reference match, expression, transcript, clonal, and anchor criteria |
|
Best Peptide doesn’t fit in any of the above tiers, usually if it fails two or more criteria |
|
Best Peptide is not expressed (RNA Expr == 0 or RNA VAF == 0) |
Criteria Details
Criteria |
Description |
Evaluation Logic |
|---|---|---|
Binding Criteria |
Pass if Best Peptide is strong binder |
binding score criteria: binding percentile score criteria:
|
Presentation Criteria |
Pass if the Best Peptide is presented by the MHC |
|
Immunogenicity Criteria |
Pass if the Best Peptide is immunogenic |
|
Scores Criteria |
Pass if the Best Peptide is a strong binder, presented by the MHC, and/or immunogenic |
|
Expression Criteria |
Pass if Best Transcript is expressed |
|
Reference Match Criteria |
Pass if there are no reference proteome matches |
|
Transcript Criteria |
Pass if Best Transcript matches any of the user-specified |
|
Low Expression Criteria |
Peptide has low expression or no expression but RNA VAF and coverage |
|
Anchor Criteria |
Fail if if there are <= 2 mutated amino acids and all mutated amino acids of the Best Peptide ( |
|
Clonal Criteria |
Best Peptide is likely in the founding clone of the tumor |
|
Problematic Position Criteria |
Best Peptide does not contain a problematic amino acid as defined by the
|
|
The pVACseq Aggregate Report Sorting
The aggregate report is sorted as follows:
Sort Criteria |
Sort Order |
|---|---|
|
“Pass”, “PoorBinder”, “PoorImmunogenicity”, “PoorPresentation”, “RefMatch”, “PoorTranscript”, “LowExpr”, “Anchor”, “Subclonal”, “ProbPos”, “Poor”, “NoExpr” |
Sum of ascending ranks of |
Ascending sum rank |
First metric specified in the |
Ascending rank |
|
Alphabetical |
|
Alphabetical |
aggregated.tsv.reference_matches Report Columns
This file is only generated when the --run-reference-proteome-similarity
option is chosen.
Column Name |
Description (BLAST) |
Description (reference fasta) |
|
|---|---|---|---|
|
The chromosome of this variant |
||
|
The start position of this variant in the zero-based, half-open coordinate system |
||
|
The stop position of this variant in the zero-based, half-open coordinate system |
||
|
The reference allele |
||
|
The alt allele |
||
|
The Ensembl ID of the affected transcript |
||
|
The mutant peptide sequence for the epitope candidate |
||
|
The peptide sequence submitted to BLAST |
The peptide sequence to search for in the reference proteome |
|
|
The BLAST alignment hit ID (reference proteome sequence ID) |
The FASTA header ID of the entry where the match was made |
|
|
The BLAST alignment hit definition (reference proteome sequence name) |
The FASTA header description of the entry where the match was made |
|
|
The substring of the |
||
|
The BLAST match sequence |
The FASTA sequence of the entry where the match was made |
|
|
The match start position of the |
||
|
The match stop position of the |
||