Getting Started
The pVACview user interface has four sections:
pVACtools Output, where pVACseq results can be uploaded, visualized/explored, and exported
Tutorials, where the pVACview app is documented in more detail
pVACview Documentation, which is a link to the documentation here
Submit GitHub Issue, which is a link to GitHub to submit bug reports and additional questions
Upload
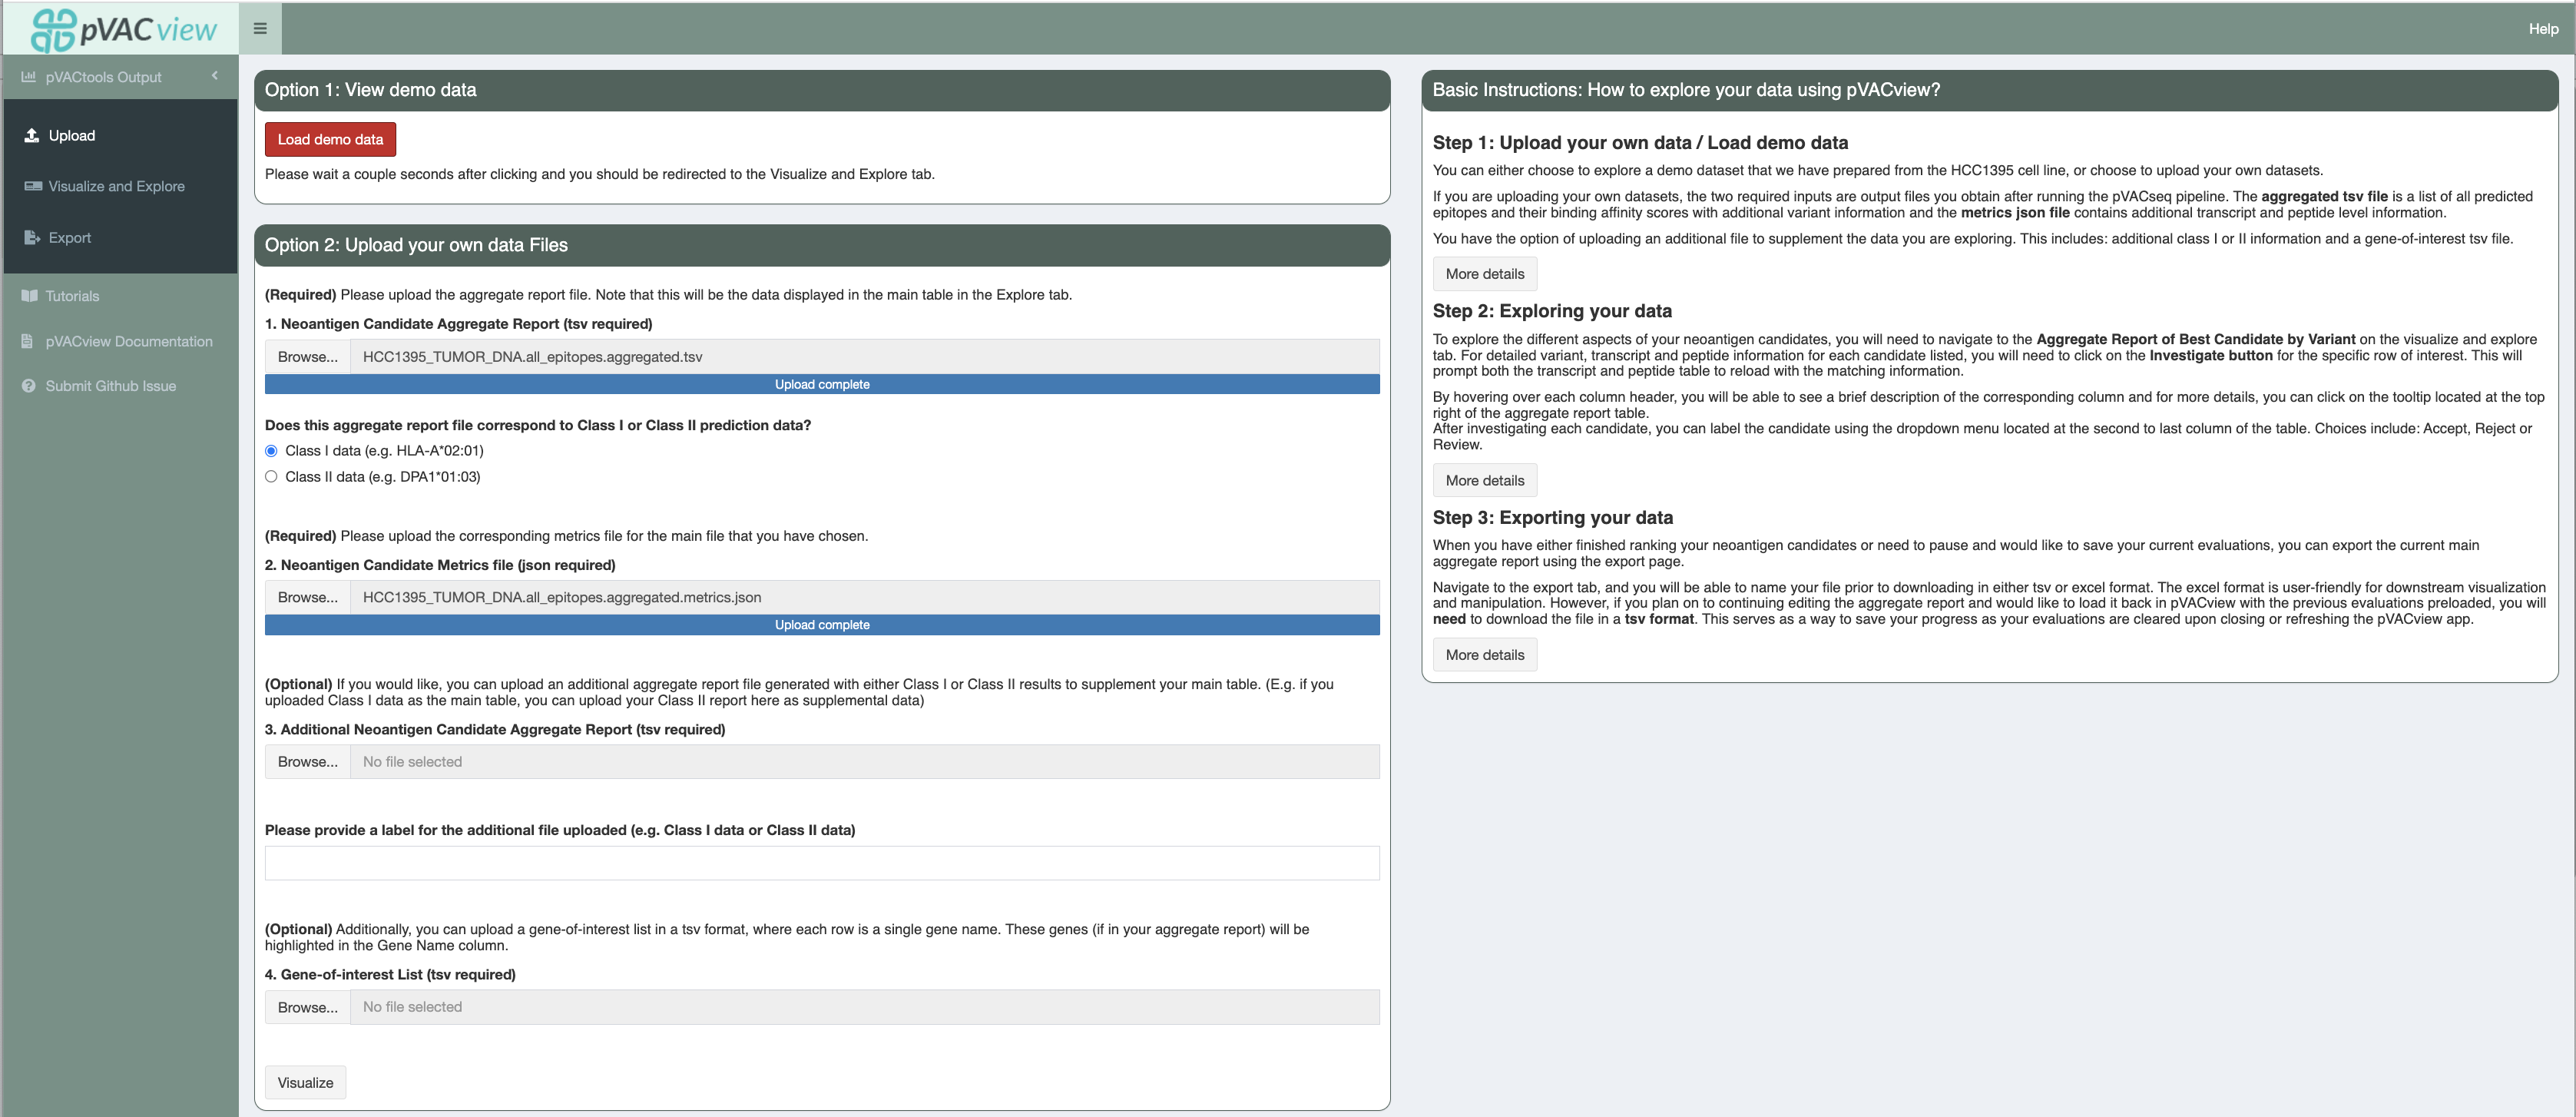
Once you’ve successfully launched pVACview by completing the prerequisites section, you can now upload your data by browsing through
your local directories to load in the aggregate report and metrics files, usually located in the same directory as your app.R file.
You will need to select the type of your files uploaded (Class I or Class II).
The two required inputs are <sample_name>.all_epitopes.aggregated.tsv and <sample_name>.all_epitopes.aggregated.metrics.json), both of which are output files from the pVACseq pipeline. The aggregated tsv file is a list of all predicted epitopes and their binding affinity scores,
with additional variant information and the metrics json file contains additional transcript and peptide level information that is needed for certain features of the pVACview application. You can find further details on them here.
You have the option of uploading an additional file to supplement the data you are exploring. This is useful in cases where you are visualizing Class I prediction data but would like to have a general idea of the variant’s Class II prediction performance or vice versa. In order to match your main data with data from your additional file, it is important that they were generated from the same set of variants (but predicted for different HLA alleles). You will also want to specify whether the type of data you are adding was generated from Class I or Class II on the upload page by selecting the appropriate radio button option.
We also provide users with the opportunity of uploading a gene-of-interest tsv file, where each individual line consists of one gene name. If matched in the aggregate report, the gene name will be highlighted using bold font and a green box around the cell.
Visualize and Explore
Data
Upon successfully uploading the matching data files, you can now explore the different aspects of your neoantigen candidates.
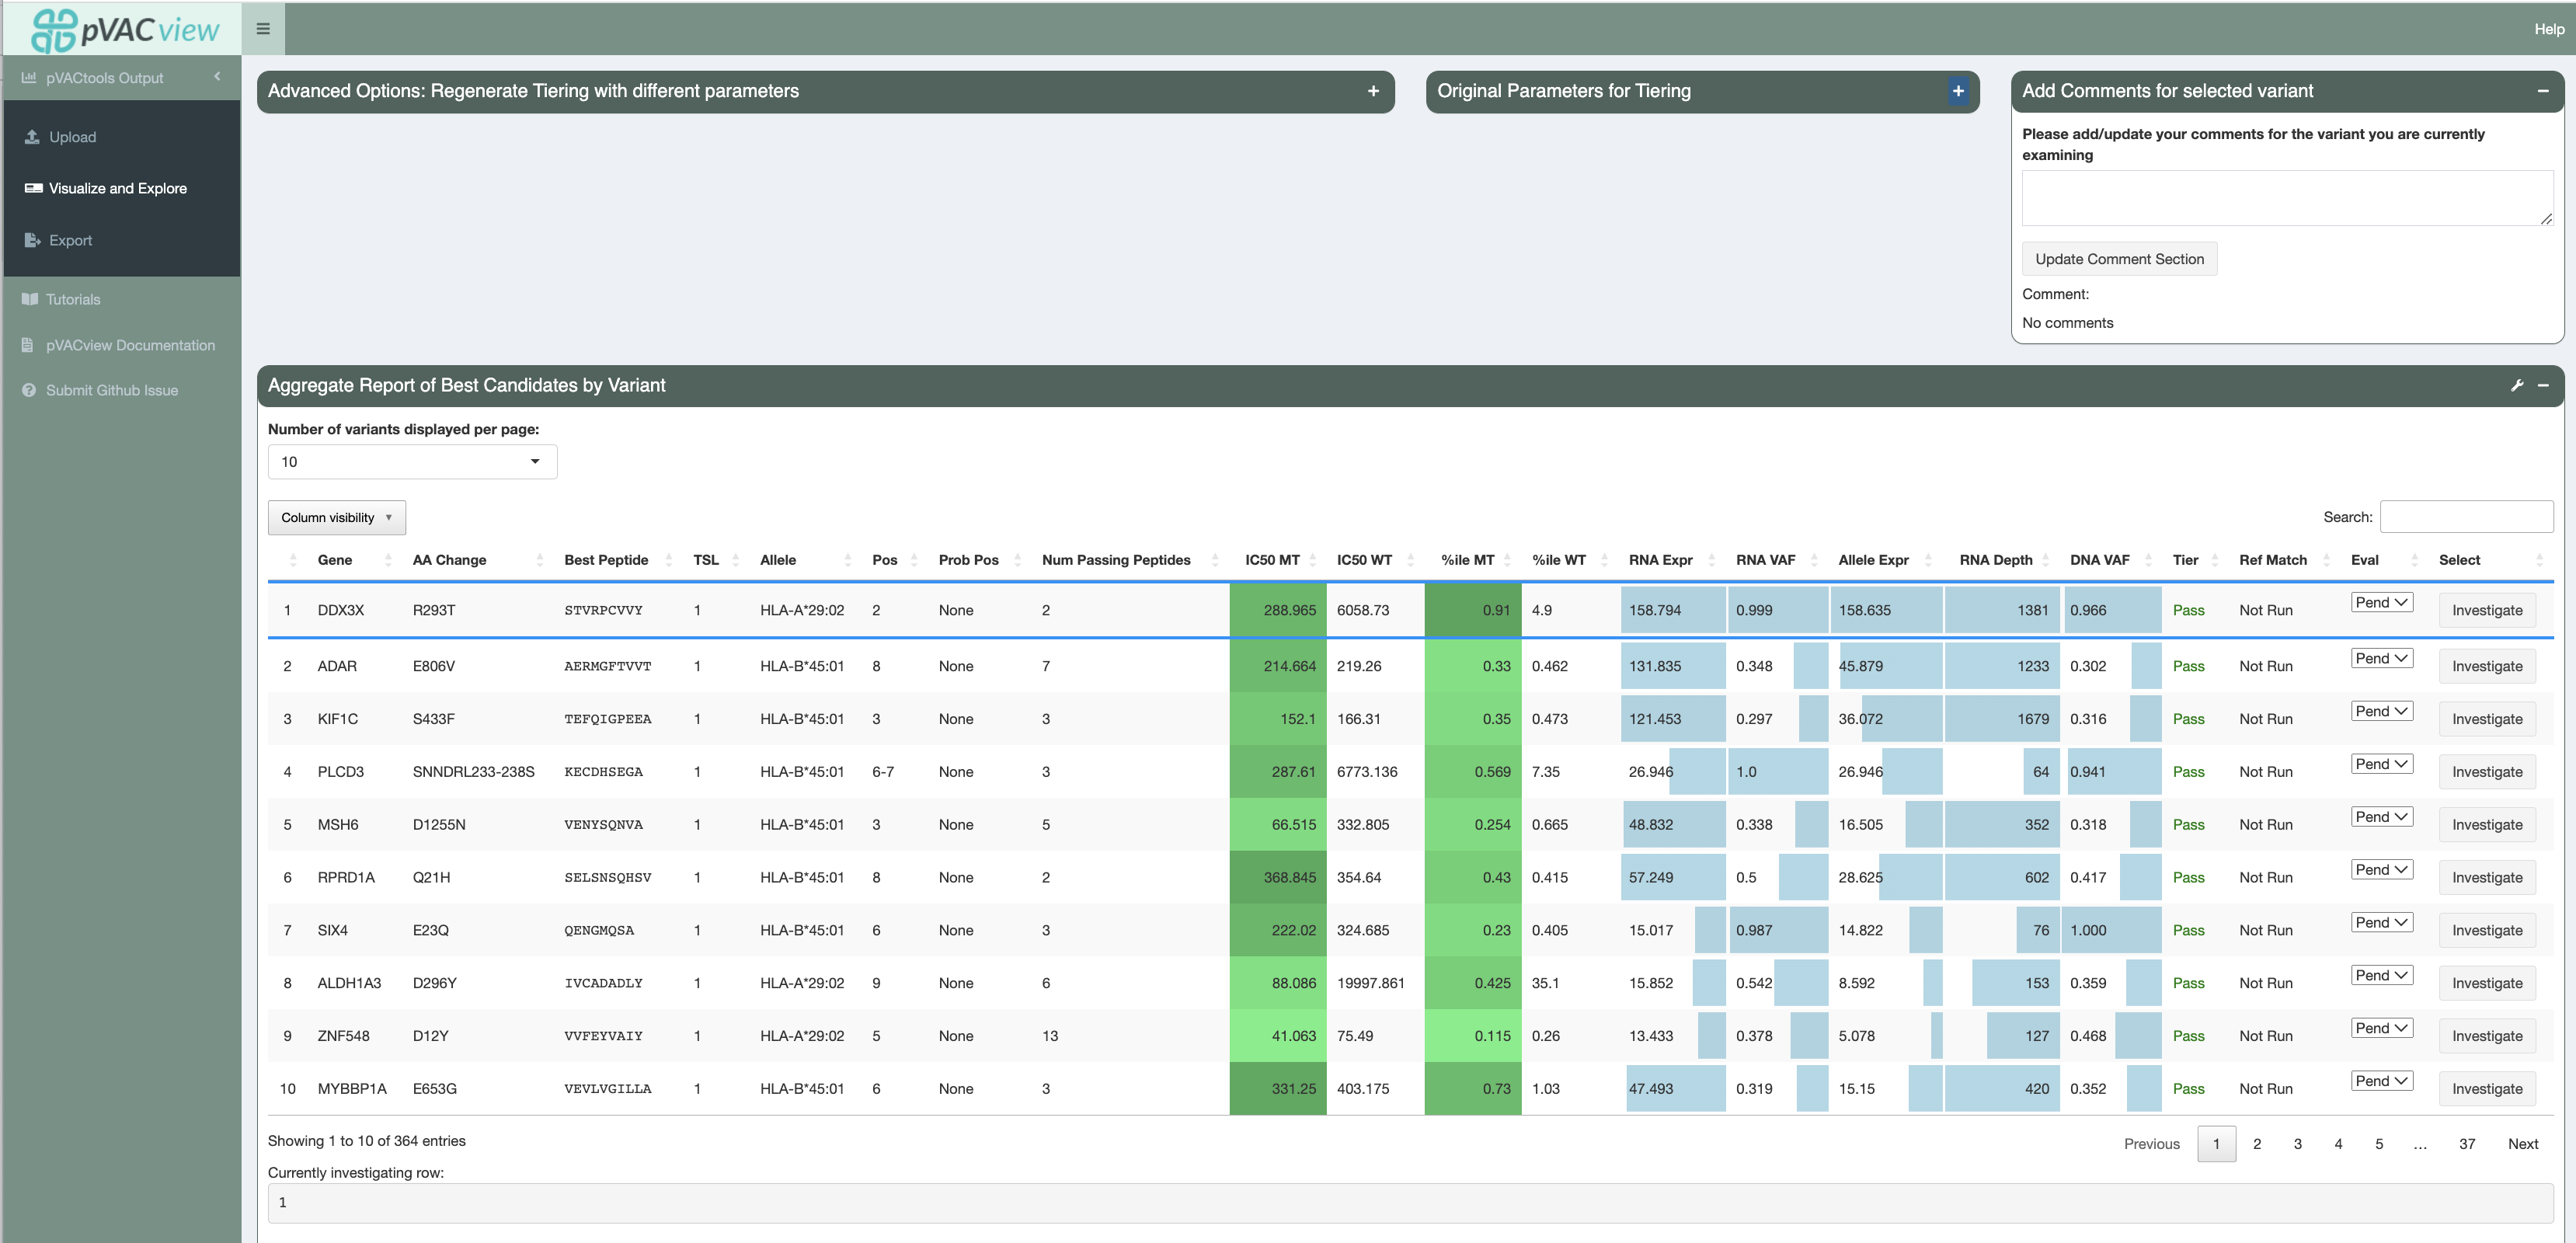
Specifically, the features can be separated into five categories:
Variant level information
Main aggregate report table showcasing best candidates by variant
Selected Variant detail information
Transcript sets for a selected variant in the main aggregate report table, where all transcripts in the set code for the same set of neoantigen candidates. The transcript set that includes the best transcript is highlighted in green and selected by default.
Reference proteome match details for the selected variant (if reference protome similarity feature was originally run)
Additional Data for the selected variant when a Additional Neoantigen Candidate Aggregate Report was uploaded
Variant & Gene Info box with VAF and expression information for the selected variant
Selected Transcript Set information
Transcripts of selected set that produces good binding peptides
Expression, transcript support level, and biotype information etc. of the transcripts in the set
Selected Transcript Set Peptide information
All well-binding peptides (for at least 1 HLA allele) in the selected transcript set. The best peptide is highlighted in green.
MHC binding prediction scores for each MT and WT peptide pair
Allele-specific anchor prediction heatmap and per-position and per-allele anchor weights
Selected Peptide information
Per-algorithm and HLA-allele MHC binding predictions for the selected peptide and its matched WT (IC50 and Percentile)
Violin plot for the IC50 and Percentile predictions
Elution and immunogenicity data for the selected peptide and its matched WT
For detailed descriptions on individual sections, please refer to features page.
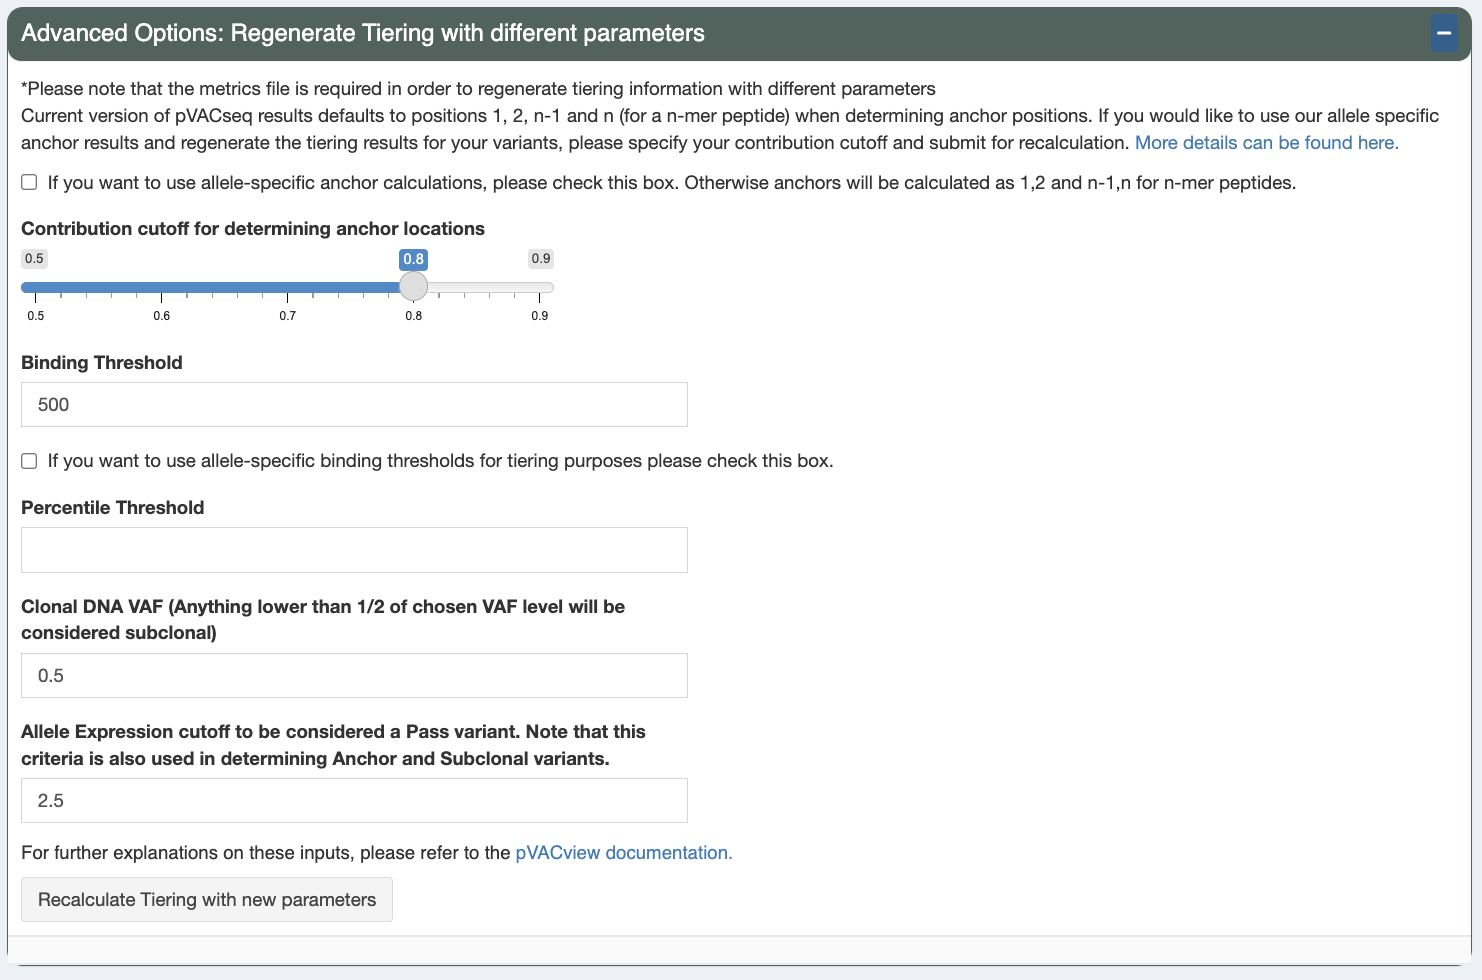
Regenerate Tiering
Additionally, you can regenerate the Tiers of variants by supplying a different set of parameter cutoffs from your original pVACseq run and pressing the Recalculate Tiering with new paramters button:
Allele-specific anchor calculations
Check this box to turn on allele-specific anchor calculations. If this option is unchecked, the following positions will be considered anchor positions: 1, 2, n-1, and n
Anchor contribution cutoff
When the allele-specific anchor calculations option is chose, this is the contribution cutoff for determining which positions of an HLA allele are categorized as anchors. Previously, our lab has computationally predicted anchor positions for different hla alleles and peptide length combinations (“Accurate neoantigen prediction depends on mutation position relative to patient allele-specific MHC anchor location”). These predictions are normalized probabilities representing the likelihood of each position of the peptide to participate in anchoring to the HLA allele. Upon the user specifying the contribution cutoff, the application calculates which positions will be included such that their probabilities add up to equal/more than the specified cutoff. (For example: if positions 2 and 9 have normalized probabilities of 0.4 and 0.5 and the user specified the cutoff to be 0.8 , the anchors will be set as 2 and 9 for the specific peptide-HLA combination)
Binding Threshold
The threshold to consider a peptide a good binder. The IC50 MT will need to be below this value
Allele-specific binding thresholds
When this box is checked, use allele-specific binding thresholds, as defined by IEDB, instead of the binding threshold set above. For alleles where not specific threshold is defined, the binding threshold set above is used as a fallback.
Percentile Threshold
In addition to passing the binding affinity IC50 threshold above, the %ile MT will also need to be below this value in order for the peptide to be considered a good binder.
Clonal variant VAF
This is the estimated DNA VAF of the clonal variant of the tumor. Variants with a DNA VAF less than half the specified number will be marked as subclonal.
Allele Expression
Allele expression is calculated as gene expression * RNA VAF. This expression value is used as a cutoff in order to determine whether the peptide has good allele expression when the Allele Expr value of a variant is above this cutoff.
These parameters will default to the value used in your original pVACseq run.
After adjusting and retiering your candidates, the currently applied tiering
parameters are displayed in the Current Parameters for Tiering section.
The parameters originally used for tiering are displayed in the Original
Parameters for Tiering section. You can reset the tiers to the parameters
used originally by clicking the Reset to original paramters button.
Investigating Different Variants
To investigate a specific variant in detail (on both the transcript and peptide levels), you will need to click on the investigate button located in the select column of the main aggregate report table (last column).
Afterwards, you may choose to select a rating for the neoantigen candidate using the Eval column. By default, all peptides are initially in a Pending state when the report is generated from pVACseq. Based on
exploration and evaluation of the features provided, you can mark the peptide as either Accept, Reject, or Review. Your current state of selections are also counted and shown in the Peptide Evaluation Overview box.
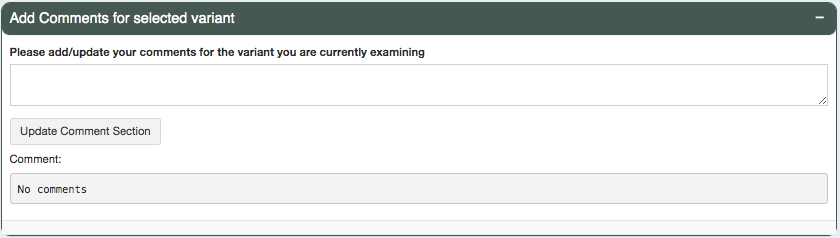
Users can add comments to each line of variants they are investigating. These comments can be reviewed in the Export page
and will be in the final output (either tsv or excel) when downloaded. This column is by default N/A unless the input
aggregate report has a Comments column pre-specified.
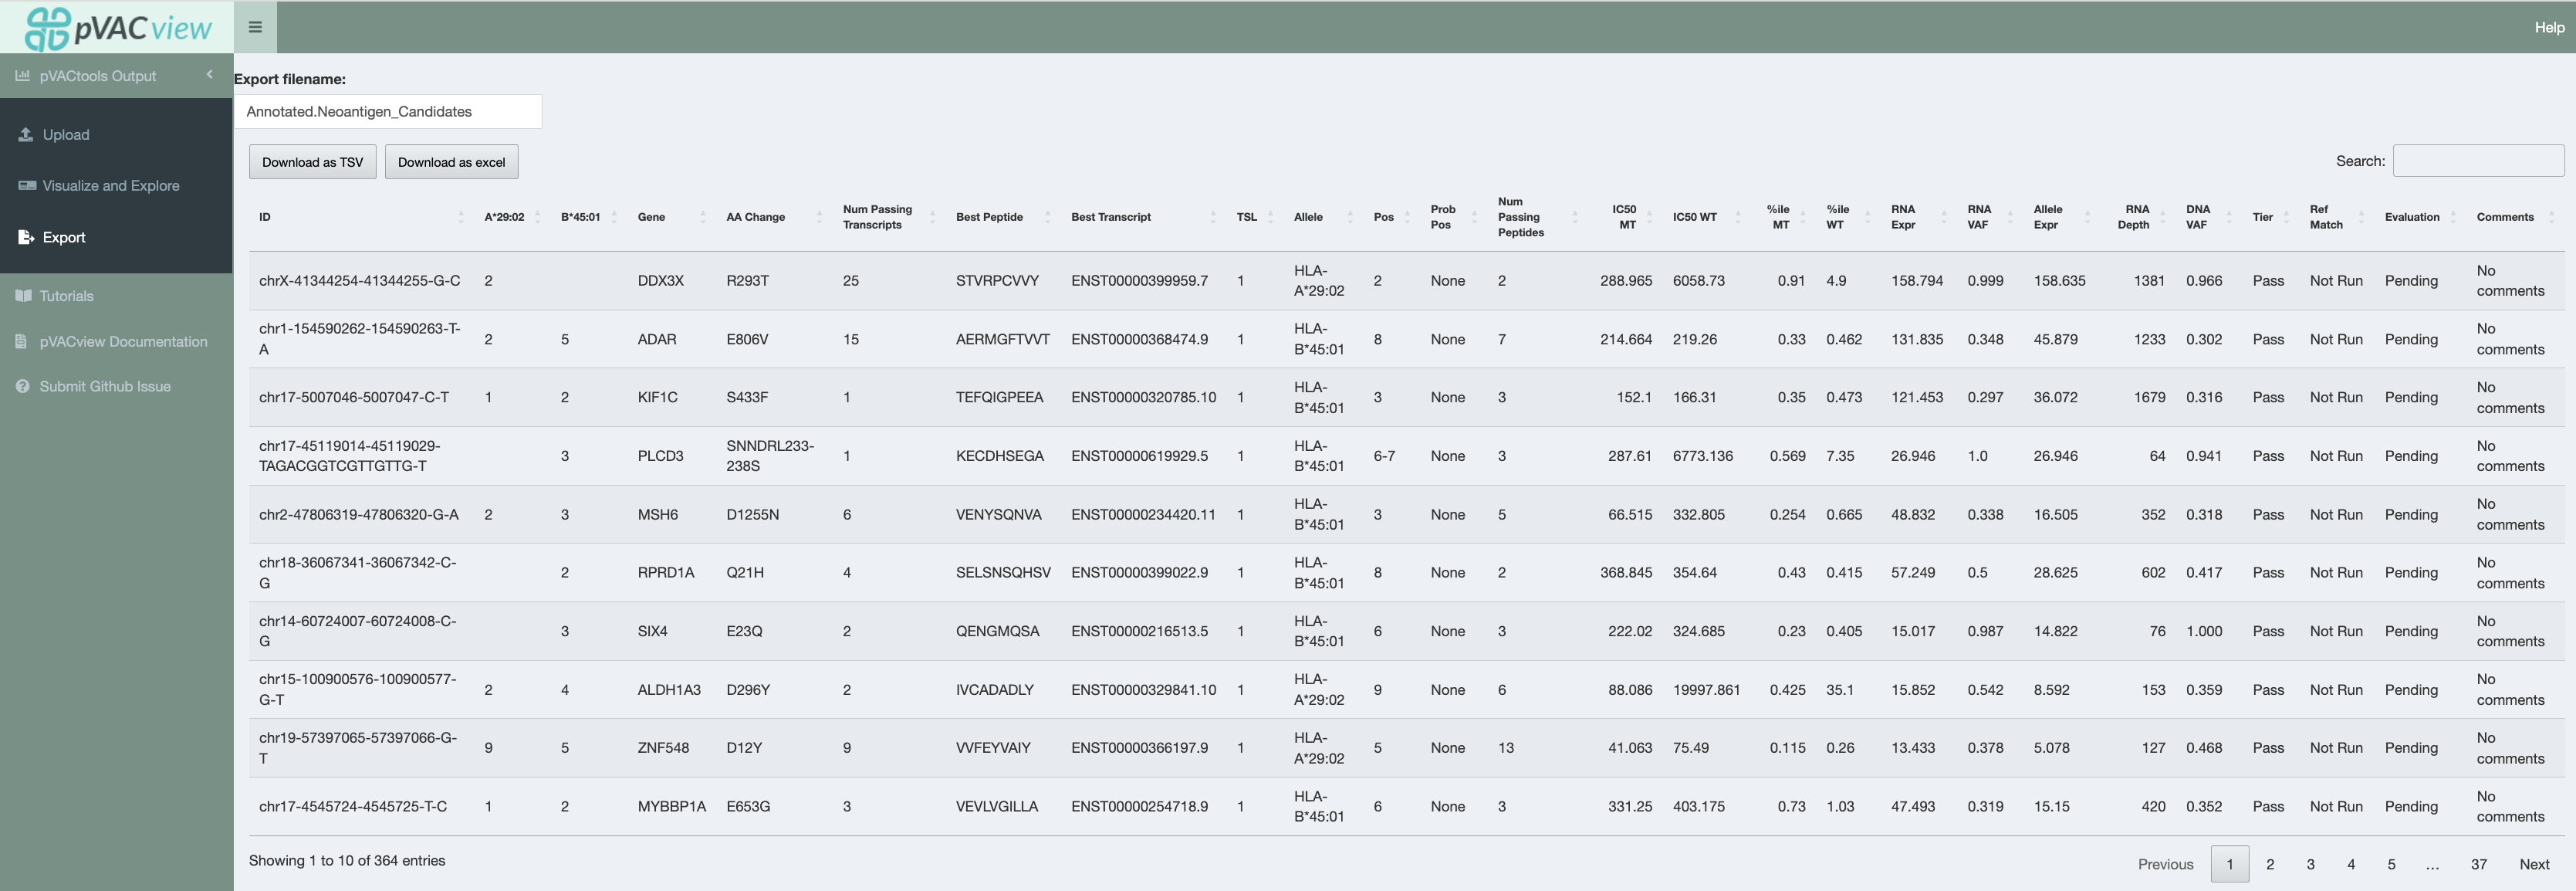
Export
When you have either finished ranking your neoantigen candidates or need to pause and would like to save your current evaluations, you can export the current main aggregate report using the export page. (If you are using R studio’s default shiny app browser, you may run into the issue of not being able to properly export depending on your version. This is also why in the prerequisites section, we recommend launching the shiny app in a different web browser)
There are a couple things to note when exporting your current data:
Export filename
By default, your file will be named
Annotated.Neoantigen_Candidates.tsvorAnnotated.Neoantigen_Candidates.xsls. You may want to modify this such that it is specific to your sample.Download as TSV/Excel
We provide two download file types (tsv and excel). The excel format is user-friendly for downstream visualization and manipulation. However, if you plan on to continuing editing the aggregate report and would like to load it back in pVACview with the previous evaluations preloaded, you will need to download the file in a tsv format.
This serves as a way to save your progress as your evaluations are cleared upon closing or refreshing the pVACview app.